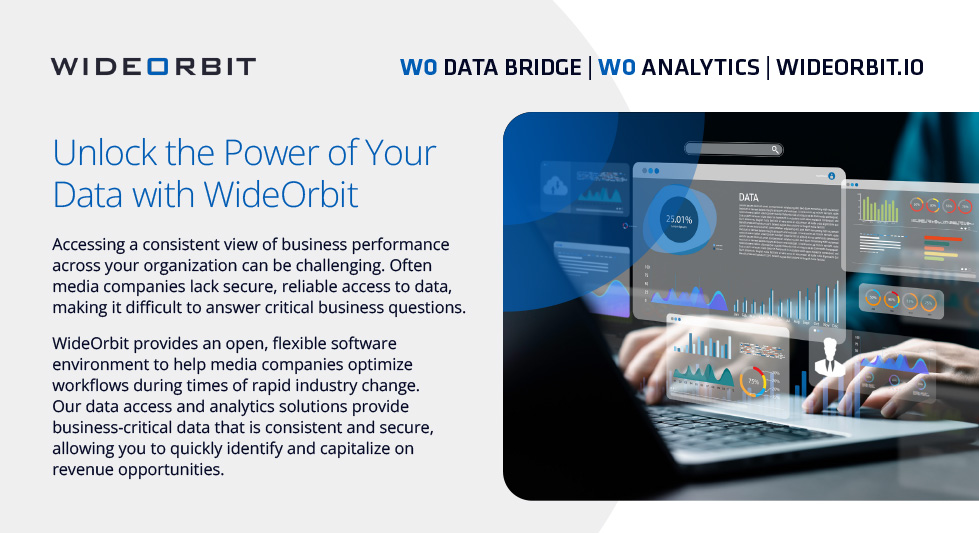
WO Analytics ETL is built specifically for the TV and radio industries to consolidate all relevant data from both WideOrbit and third-party systems within a single analytics platform. A unified view across channels, markets, and platforms makes it simple for any user to analyze business performance, spot inefficiencies, and pinpoint new revenue opportunities.
WO Analytics allows you to:
Aggregate data across departments to make faster, more intelligent decisions
Analyze and improve business performance
Identify new revenue opportunities
Save time by streamlining reporting across departments or properties
WO Analytics provides the business insights media companies need most
-
Media-centric
Purpose-built for the media industry with media-specific KPIs
-
Access your WideOrbit system data
Get the full picture with your WideOrbit system data in one place
-
Pre-built dashboards
Easily track pricing, revenue, and sales insights to go beyond “what” happened to discover “why”
-
Unified view
See business metrics across stations, markets, and platforms
-
Multi-user
Supports multiple user accounts and permission levels
-
Flexible
High-level overview or drill-down analysis
-
Analytics server
Keep data up-to-date and easily accessible
WO Analytics ETL
WO Analytics ETL is a back-end solution that provides access to all WideOrbit data through a pre-built extract, transform, and load (ETL) process. With business logic applied at every level, you can build corporate data warehouses for immediate access to data with third-party business intelligence solutions. We can also provide pre-built integrations upon request.
Plug and play
Immediately access your WideOrbit data within your data warehouse with seamless, proprietary, intelligent data mapping
Leverage your systems
Continue using your existing front end business intelligence platform
Peace of mind
Peace of mind knowing that WideOrbit is managing and monitoring your business-critical data flow
WO Data Bridge
Certain business requirements call for access to curated data for analytical and business intelligence workloads. This can be challenging for media companies using any combination of systems that are on-premise, cloud-based, and/or hosted by WideOrbit, resulting in multiple backend database types. WO Data Bridge revolutionizes large dataset management, providing a gateway to advanced business intelligence and analytics. WO Data Bridge provides access to data in various forms, including raw and curated.
Raw and Curated Data
Feed raw and/or curated data to your data lake, corporate data warehouse, or data unification platform
Multiple Daily Data Loads
Data loads scheduled multiple times per day, with big data extracted from the individual source row-level
Bring Your Own Platform
Choose the ideal platform* for your business intelligence strategy and WideOrbit will ensure your data is delivered, transformed, and stored
Discover which data solution is right for your business
| Feature | WO Analytics ETL | WO Data Bridge | WideOrbit.io |
|---|---|---|---|
| Multiple data refreshes available | No | Yes | Yes, every 5 minutes |
| Hardware investment required | Yes | No | No |
| Implementation time | 2 Months | 2 Months | 1 Day (configuration) |
| Quantity of data sources supported | Multiple | Multiple | One |
| Custom data import from non-WideOrbit sources | Yes | Yes | No |
| Access historical data to see long term trends | Yes | Yes | Yes |
| WideOrbit product integrations support | WO Traffic, WO Network | WO Traffic, WO Network, WO Omni, WO Fusion, WO Digital Hub | WO Traffic, WO Network, WO Omni |
| Integrated with Revenue Analytics® for revenue insights | Yes | Yes | N/A |
| Pre-built data warehouse | Yes, on-premise | Yes, multi-cloud hosted environment | N/A |
| Data processing type | ETL | ELT | N/A |
| Pre-built business logic and data sources | Yes | Yes | N/A |
| Dashboards to visualize data in your business intelligence or visualization tool, based on your business needs | Available as a WideOrbit Professional Services engagement | Available as a WideOrbit Professional Services engagement | N/A |
Learn how WideOrbit data solutions compare
Discover which solution is right for your business
Download
Let's talk
Please complete the form to learn more about WO Analytics or to schedule a demo.
